After finding myself spending much time on Twitter than most of the other social media I use, I started to play with its data through its APIs it offers to developers. I come up with this idea of monitoring tweets contain keywords I might be interested in. Using ELK stack you can choose to monitor buzzwords from “blockchain”, “AI”, “built with Go” to “storming area 51” :)
At the end of this article, I will use “Rwanda” as an example whereby I am going to get all tweets in real-time that have the word “Rwanda” in their texts then we analyze them to get an insight.
First of all, what is the ELK stack?
ELK stands for Elasticsearch-Logstash-Kibana. It’s a stack of open source tools from Elastic most commonly used in log collection, analysis, and visualizations. Even though there are many cases you can use ELK such as monitoring your apps, your infrastructure, etc. and for the stack to achieve this work different numbers of tools are used and in this article, we will explain the role and use of the most popular tools used by the stack.
The Role of each tool in the stack.
Logstash: Logstash is the first entry data flow in ELK. It accepts data from different sources, normalizes them, then sends them to the destination of your choices such as CSV file, WebSockets, S3, MongoDB, Graphite, google_bigquery, Kafka, and Elasticsearch (which we are going to use in this scenario), etc. You can find all the outputs supported by Logstash here.

Looking at this image I took from their official website. Some of the inputs Lostash can support are files, Redis, Log4j (a Java-based logging utility), Sqlite, Syslog, Github, Twitter (which I’m going to use), and Beats (they call them Data Shippers because they are the most commonly used in collecting logs and ship them to Logstash in most scenarios).
Elasticsearch: This is the cornerstone of the stack, it is a RESTful search engine, it stores the data come from Logstash. It is a full-text search that you can go far beyond querying data and aggregation to find trends and patterns in your data.
Kibana: This is where Visualization and exploration of data are made. It is a browser-based interface with dashboards that display your data in various ways such as charts, tables, and maps.
Enough of explanations, let’s get started with monitoring some Twitter keywords with Elastic stack :D
We are going to need Twitter Stream API, we are going to listen in real-time (not real real-time) to the tweets contain certain keywords of our choices.
If you don’t have a Twitter developer account you can go and apply for it here, Hopefully it won’t be hard for you like it was for me when I applied for it previous months. You know, These days with Cambridge Analytica scandals, Russia getting accused of using data they obtained from social media in meddling Presidential election in the US. Nowadays Social media started to make it hard and impose many restrictions on who can access their users’ data and what he’s going to do with it. With this much data you can do harm. I had to apply ->get rejected, re-apply -> get rejected, re-apply again -> now Accepted :D
After getting Twitter APIs keys, we are good to go. We need a server online that will have to host the ELK stack (sometimes it is good to separate every tool on its box but this is experimental so we are going to install all of them in one box).
My favorite Cloud infrastructure provider to rent small Linux VPS boxes is DigitalOcean, but if you prefer other else you can use them. Let’s go there spin up a new VPS box and choose one of Linux distributions to use.
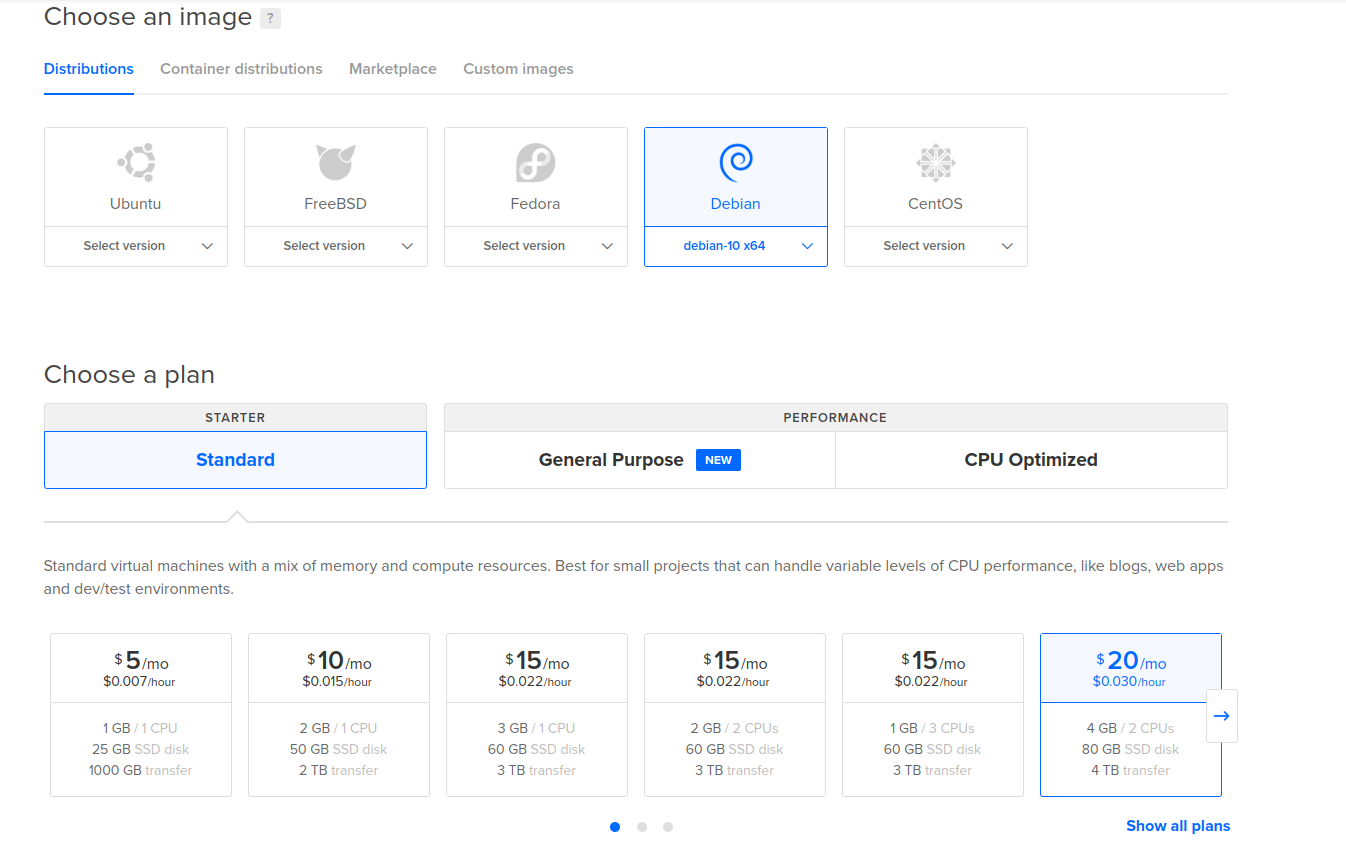
I’m a Debian fanboy, that’s why I’m using Debian buster (version 10). Since Logstash and Elasticsearch are more resource-hungry when processing much data, I choose a box with 4GB memory capacity and 80 GB SSD disk storage billed at $20 monthly. Since I will run this box for a short time, maybe a week is enough for this experiment. after that, I will shut it down and destroy it so the bill won’t even exceed $10.
Installing the stack
The next step is to install the tools, it’s better if we start with Elasticsearch.
install Elasticsearch
You can choose to download the deb packages from the elastic website or use APT package manager. I choose to download the deb file and install it manually.
$ wget https://artifacts.elastic.co/downloads/elasticsearch/elasticsearch-7.3.0-amd64.deb

$ sudo dpkg -i elasticsearch-7.3.0-amd64.deb
Start elasticsearch as a daemon
$ sudo systemctl start elasticsearch.service
To check if everything is alright you can send a request to elasticsearch on its RESTful API to see what is going inside.
$ curl -X GET "localhost:9200"
You should get a response similar to this, with a tagline saying “You Know, for Search”.
{
  "name" : "elk",
  "cluster_name" : "elasticsearch",
  "cluster_uuid" : "AmDRt2a3RpWsgYi-VRNHHw",
  "version" : {
    "number" : "7.3.0",
    "build_flavor" : "default",
    "build_type" : "deb",
    "build_hash" : "de777fa",
    "build_date" : "2019-07-24T18:30:11.767338Z",
    "build_snapshot" : false,
    "lucene_version" : "8.1.0",
    "minimum_wire_compatibility_version" : "6.8.0",
    "minimum_index_compatibility_version" : "6.0.0-beta1"
  },
  "tagline" : "You Know, for Search"
}
Everything is Okay, Elasticsearch is ready to accept data. Now we move on to Logstash.
Logstash requires JAVA to run, to install JAVA runtime on your server you can choose from the official Oracle distribution or use open-source OpenJDK version. Since I’m also an open-source fanboy, I’m installing OpenJDK version 11 which Logstash recommends,
$ sudo apt-get install openjdk-11-jre
Now you can check if you have java on your server by running
$ java -version
install Logstash
$ wget hhttps://artifacts.elastic.co/downloads/logstash/logstash-7.3.0.deb

$ sudo dpkg -i logstash-7.3.0.deb
Let’s configure Logstash to accept data from Twitter, Logstash have this concept called Pipeline that contains three stages (input, filter, output) The basic idea is, you get data from inputs, filter what you want in data through the filters then send your clean data to outputs of your choice.
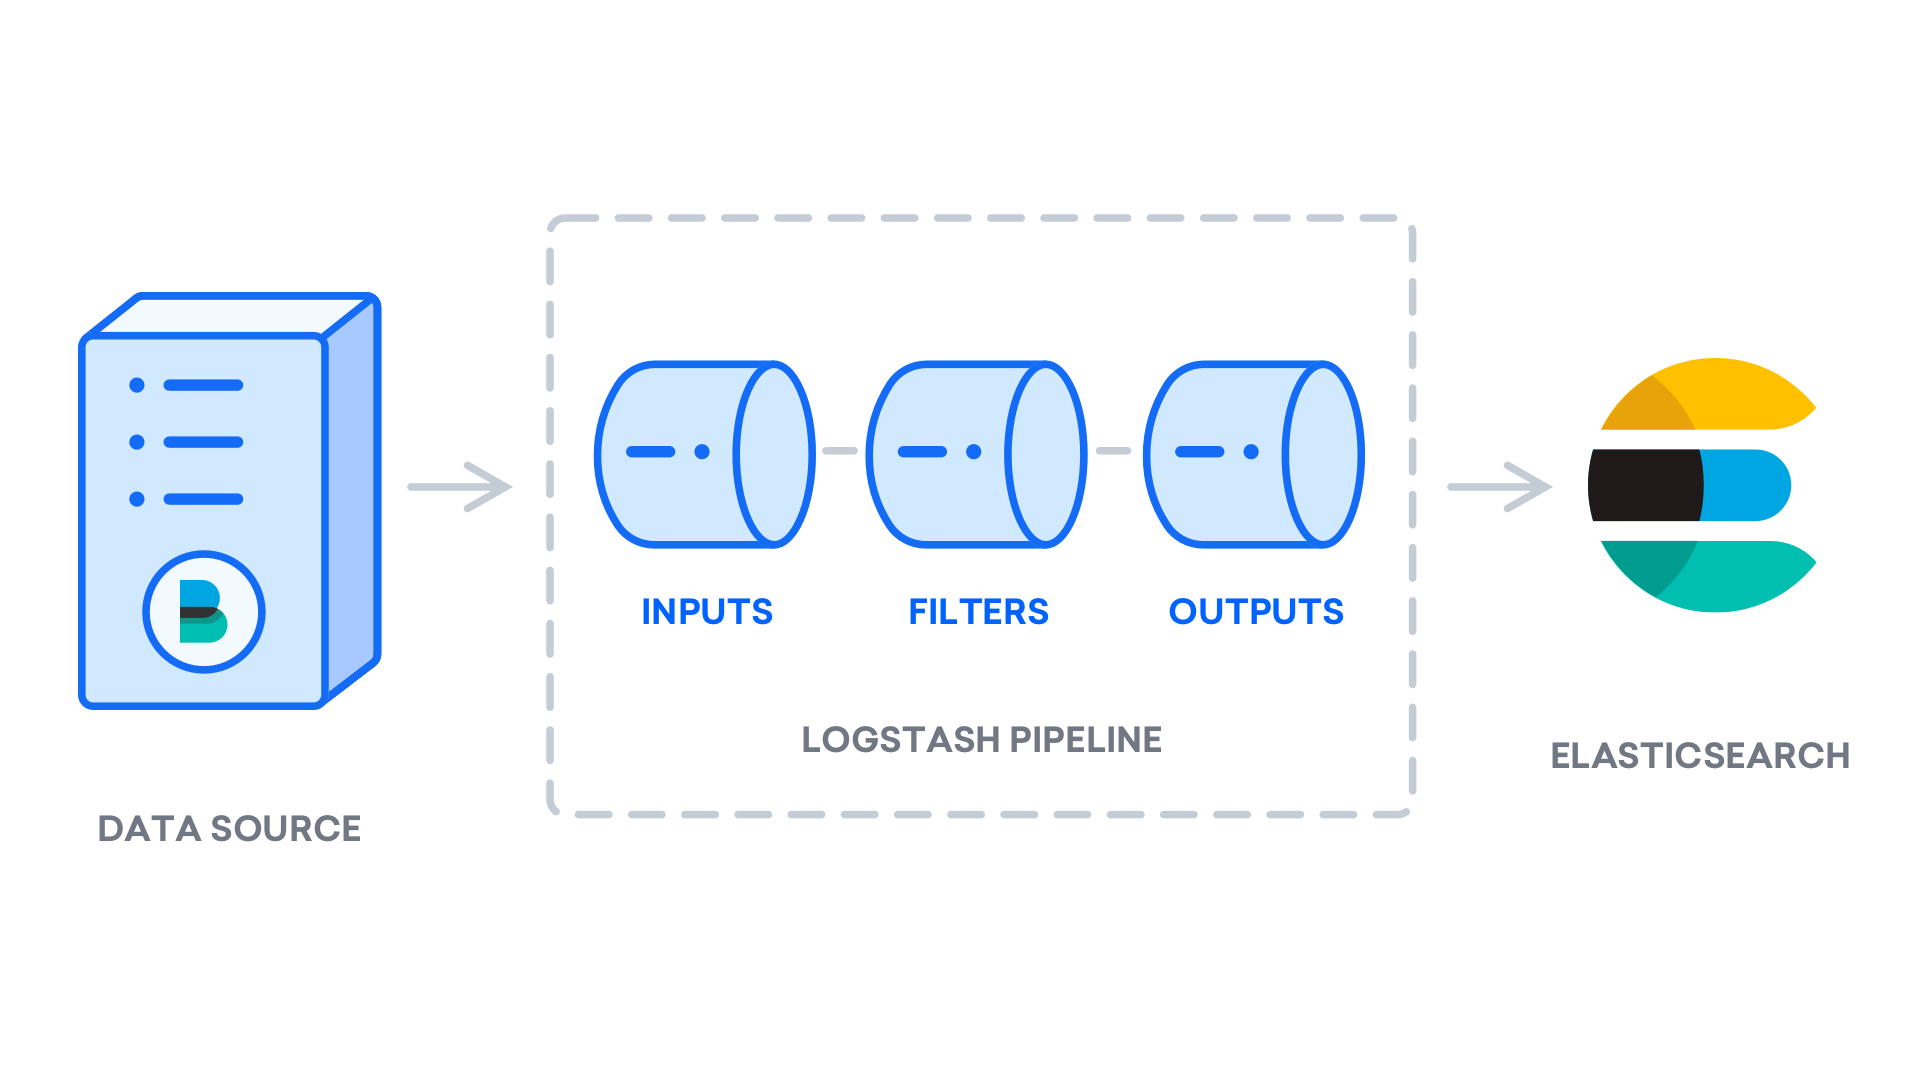
Here’s my pipeline configuration in /etc/logstash/conf.d/tweets.conf file
input {
  twitter {
    consumer_key => "XXX"
    consumer_secret => "XXX"
    oauth_token => "XXX"
    oauth_token_secret => "XXX"
    keywords => ["rwanda"]
    ignore_retweets => true
    full_tweet => true
  }
}

filter {
}

output{
  elasticsearch {
    hosts => ["127.0.0.1:9200"]
    index => "twitter-%{+YYYY.MM.dd}"
  }
}
Now you get it, it’s simple. My input is Twitter, I’m not using any filter(Why? by default twitter send data in JSON format and any field in the data is useful, so I’m not throwing away anything ), my output is Elasticsearch. If you look quite well in the input twitter configuration there’s a line with “keywords” since I live in Rwanda I choose to add “rwanda” and see anyone tweeting about Rwanda in real-time. You can add any interest of yours
The first thing you should do is to test if your configuration doesn’t have syntax errors.
# /usr/share/logstash/bin/logstash --path.settings /etc/logstash/ -t
the “-t” check for errors and exit.
if everything is OK, you can start the Logstash so it can ingest data in Elasticsearch.
$ sudo systemctl start logstash.service
Now we are receiving data from twitter.

Twitter data are being ingested in Elasticsearch, we can do any analysis with them by sending requests to Elasticsearch restful API.
But let’s not waste time, let install Kibana which will do all the queries for us and help us to visualize the data.
Install Kibana.
$ wget https://artifacts.elastic.co/downloads/kibana/kibana-7.3.0-amd64.deb

$ sudo dpkg -i kibana-7.3.0-amd64.deb
start Kibana
$ sudo systemctl start kibana.service
Since Kibana runs on localhost, port 5601. I want to access it on my local computer through a web browser and be able to create all the visualizations I need. a reverse proxy running there on the server is needed that will take our browser requests and pass them to the Kibana running locally there. Here we go.. NGINX :)
Let’s install Nginx and configure it to run as a reverse proxy
$ sudo apt-get install nginx
Configure the reverse proxy in /etc/nginx/sites-available/kibana_rev file.
server {
        listen 80;
        listen [::]:80;

        access_log /var/log/nginx/reverse-access.log;
        error_log /var/log/nginx/reverse-error.log;

        location / {
                    proxy_pass http://127.0.0.1:5601;
  }
}
create a symbolic link.
$ ln -s /etc/nginx/sites-available/kibana_rev.conf /etc/nginx/sites-enabled/kibana_rev.com.conf
restart Nginx for change to take effect
$ sudo systemctl restart nginx.service
Now hit your server IP in your favorite browser. Create a new index in Kibana, I called mine ‘tweets-‘. boom…
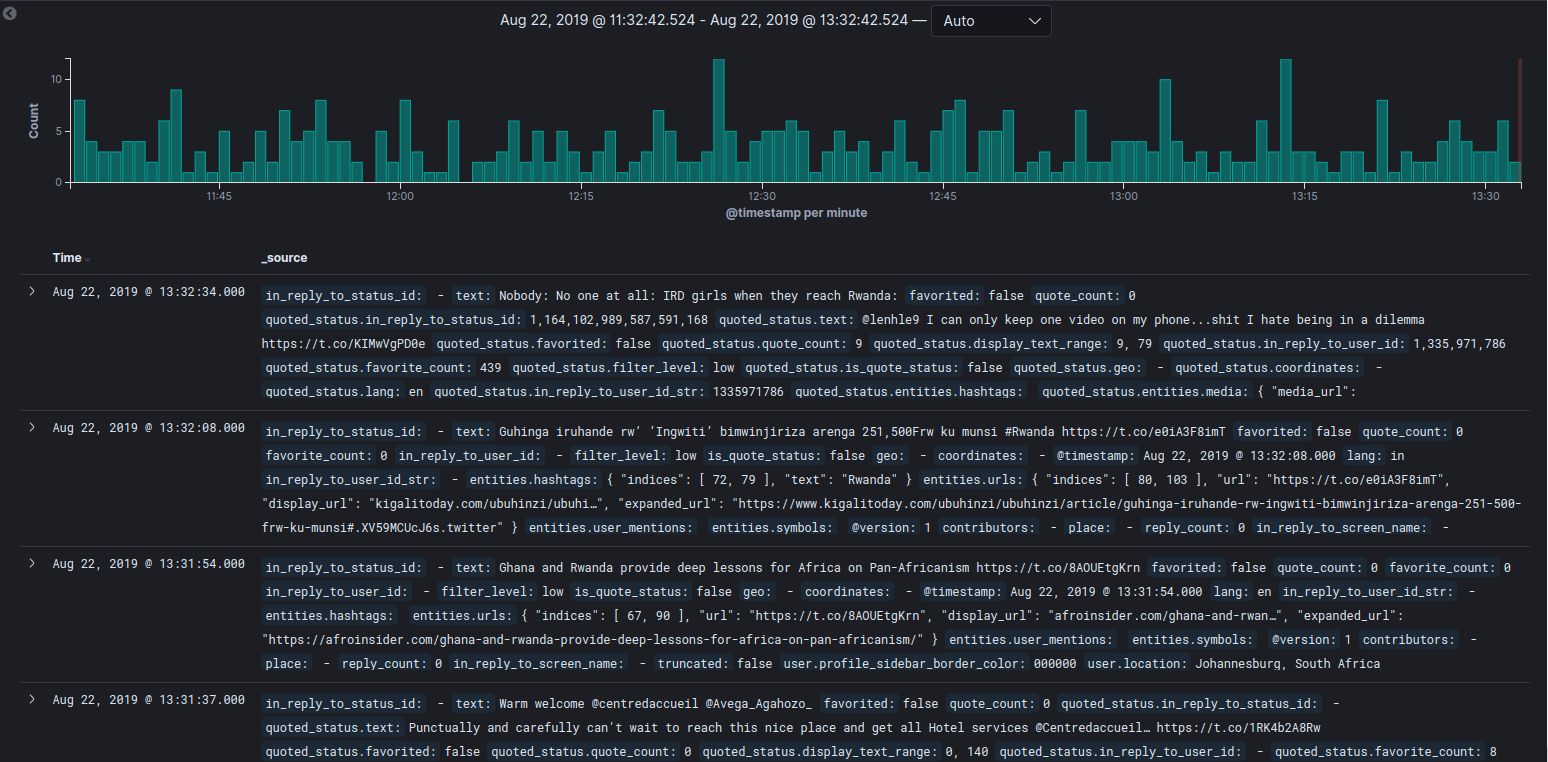
You can see the timeline of how many tweets contains ‘Rwanda’ in the last 15 minutes, below the timeline there are the latest tweets contain word ‘Rwanda’.
I’m not going to waste time showing how to create visualizations in Kibana you can read their docs, it details everything well.
So, What is in The Data we collected from Twitter?
I let Logstash run for 3 days so we can have enough data to play with. Here’s what I found in those 3 days. Not Going to share all of it.
There were approximate ~50 tweets contain the word Rwanda in every 15 minutes.
Most tweeted #Hashtags in tweets contain word Rwanda
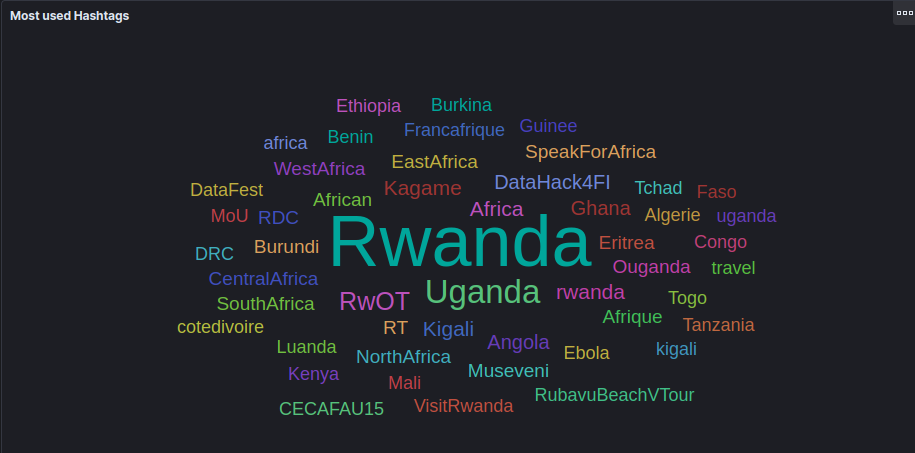
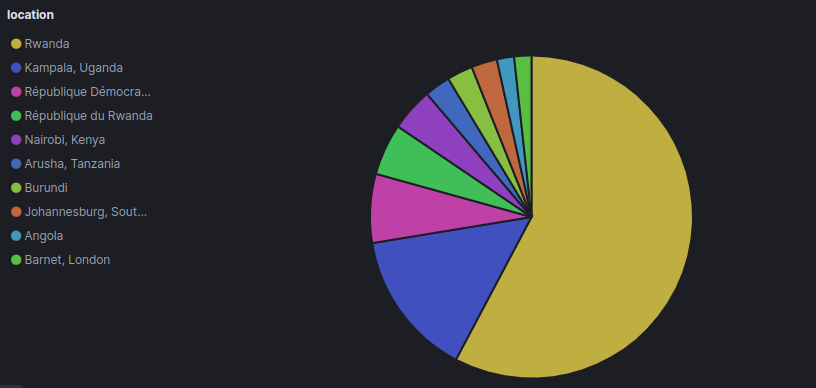
Location of people tweeted tweets contain word Rwanda in those 3 days.
Most mentioned handlers in those 3 days.

With well-written elastic documentation, you can do more with ELK, you just sit down and read. For people who don’t want to run Elasticsearch on their own, Elastic provides “Elastic as service”. you pay and everything is managed for you.
There is much to share from this, but the intention was to use the ELK, see how the tools are interconnected and how to configure them just to have the stack running in a short time.
Out there, they are many Monitoring tools I want to try out myself like Grafana ,Graphite and Icinga.
I guess I will find time to play and write about them.
Back
